Matthew Keir
posted this
28 September 2020
- Last edited 05 October 2020
Hi Anthea,
Further to Malcolm's comments.
Take a look in the glossary for more detail https://www.emi.ea.govt.nz/Glossary/#N
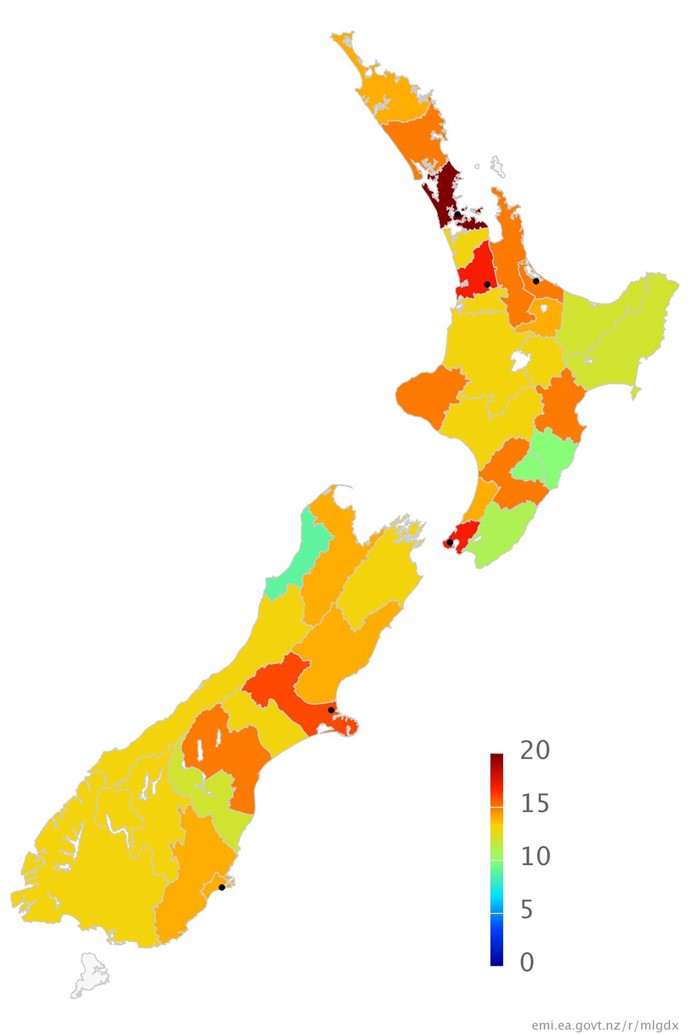
NRR's are true regions and don't reflect ownership (eg by a distribution company) although we do provide details the main distributor in each region in parentheses.
There are 39 of these regions which provides a useful resolution on things like:
- how the market is performing,
- how actively specific regional groups of consumers are engaging with the market,
- helps with things like local temperature effects of demand,
- identify metering differences that can exist for legacy reasons and can result in a retailer only offering products and services in selected NRR's rather than across a whole ownership region.
The regions are defined in the NSP mapping table.
For example, consumer retail parent company choice (below) or residential consumption each quarter
I hope that helps,
Matthew


