The physical wholesale position report is a companion report to the vertical integration report. While vertical integration doesn't differentiate between an independent seller or purchaser, this report highlights the degree to which a company is long (positive) or short (negative) on physical generation. To say this another way, it shows the proportion of a company's generation or demand that is exposed to the physical wholesale market. A position measure of 100% indicates a business which generates to supply the wholesale market, whereas -100% indicates a business that consumes energy supplied by the wholesale market (e.g a retailer or direct consumer). The report ignores any financial derivative or hedge positions held by parent companies.
Users can explore trends in physical position from an annual time scale down to a trading period level for individual companies or an aggregation of small and large businesses. The trends are available at national or island level.
Select the "All dashboard instances" button at the top right to see some examples from other users of insights that can be drawn from the report. A couple of examples are included below.
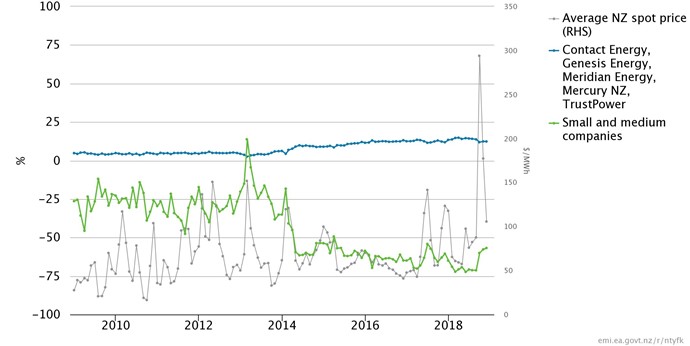
The five largest incumbent companies reached 14.8% long on generation for April 2018
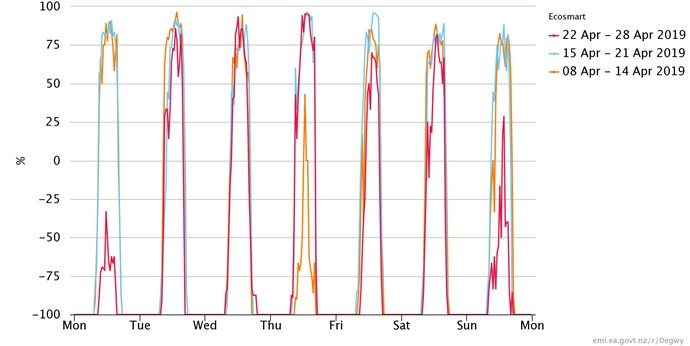
Night/Day position oscillation for small solar companies (last three weeks)