We’ve released two more league table reports summarising annual changes in retail market activity.
Switching league table
2017 saw a new record for total switches. This report provides comparative measures across regions and the change on the previous year. New metrics are introduced that provide more information on what is driving the switching numbers. The new information is a distinct switch measure and a distinct switch rate measure. For example, the distinct switch rate over the last five years tells us that 54.3 per cent of connections have changed supplier one or more times. It is these connections that have generated more than 2 million switches over this time period.
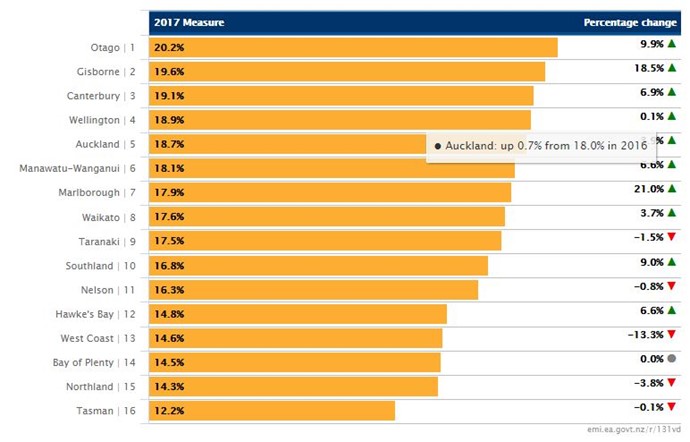
Nationally, the distinct switch rate over 2017 was 17.9 per cent a percentage increase of 4 per cent on 2016.
Distinct switch rate across the regions, 2017

Also, see new dashboards released.
Market concentration league table
Less concentrated markets deliver more competitive outcomes. We use the Herfindahl-Hirschman Index (HHI) and concentration ratios to measure market concentration. No new information is provided in this report. It simply summarises the concentration measure and annual change in the measure making it easy to see which direction things are heading and where changes are occurring most rapidly.
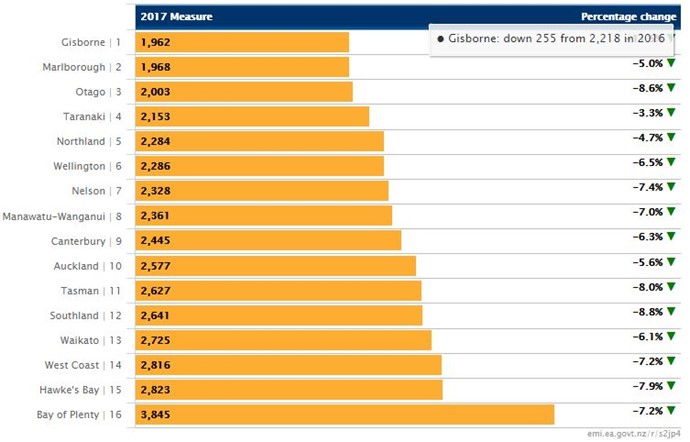
In 2017 all regions observed a drop in the HHI, with the Gisborne region having the lowest concentration by this measure as well as the highest percentage reduction over the year.
Regional market concentration measured by HHI, 2017

In regional markets, kiwi consumers will, on average, see their largest local retailer with a market share of 40.2 per cent. This measure declined at a rate 4.5 per cent in 2017; a similar rate to the last couple of years.
As with all league table reports users can hover over the bars or change numbers (on the right-hand side of the table) to expose a tooltip and gain more insight into the differences over the year. Even more information is available on the data tab.
Also, see new dashboards released.

