Residential savings
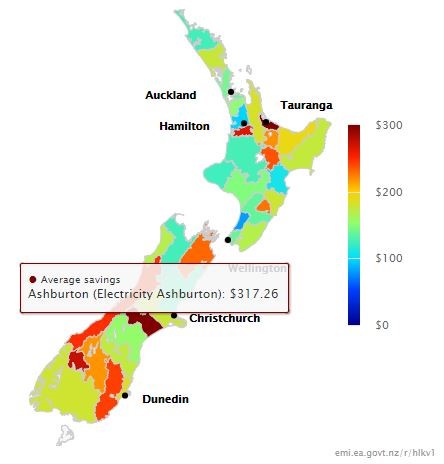
Estimated residential average savings figures for 2016 were $164 per residential connection or $291 million in total. These figures estimate the average savings available across all residential consumers if they had switched to the lowest priced generally available plan each month.
The average national figure dropped about $10 from 2015 as the market responded with consumers switching and retailers changing relative prices to their competitors within the regional markets.
Residential savings are available in the following reports:
Figure 1: Residential average savings by network area, 2016

Residential consumption
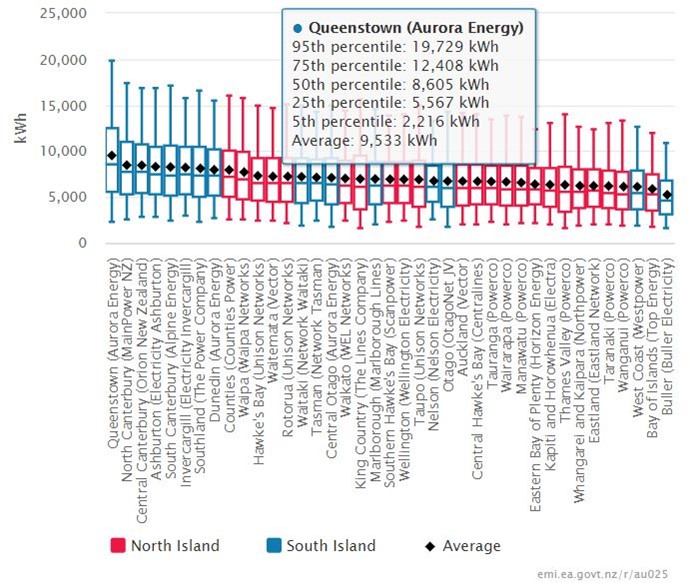
2016 had a warmer than usual start to winter, contributing to a 1.7 per cent decrease in average residential consumption over 2015. Total residential consumption was one per cent down on 2015 and accounts for just over 30 per cent of total demand.
Residential consumption is reported in the following reports:
- Quarterly residential consumption dashboard
- Residential consumption map
- Residential consumption league table
- Residential consumption distribution (monthly detail available)
Figure 2: Distribution of annual residential consumption, 2016


