Hi Dave
There is nothing particularly unusual about the price oscillations you have highlighted. This often occurs at times when demand is decreasing or increasing quite rapidly from one trading period to the next and market conditions, i.e. the supply-demand balance, are tight.
You are correct in stating that once the gate is closed, the only SPD inputs that should be changing in the RTD cases are demand, wind generation, and any system security constraints that Transpower invokes/revokes.
To be clear, prices from the RTD cases are not published; when you say RTD prices you are actually referring to RTP prices (prices produced by the real-time pricing schedule).
During the trading periods shown in your post, demand was declining rapidly from 22:00 on 13 July to 02:00 on 14 July – see Figure 1. Demand then picked up quite quickly starting at about 05:00 on 14 July and continued to increase through to about 08:00. This alone is sufficient to explain why the RTD prices started above the PRS prices and ended below the PRS for all trading periods from 22:00 on 13 July through to 02:00 on 14 July.
Figure 1: RTP demand from 13 July 22:00 to 14 July 08:30

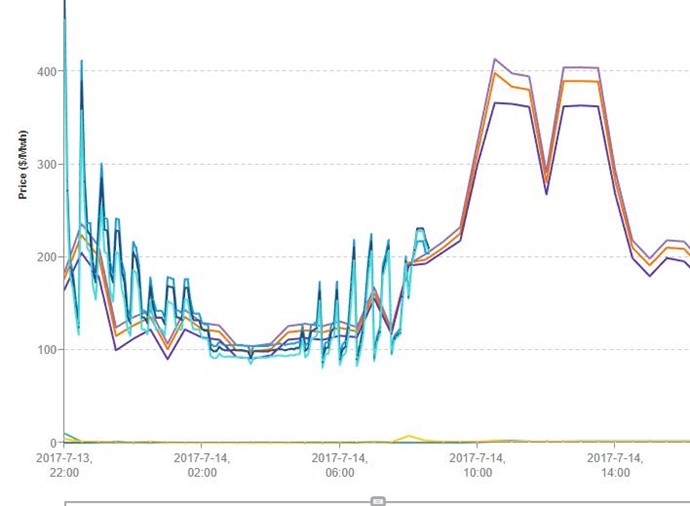
The supply side of the story can be understood by examining energy offers. As can be seen in Figure 2, the energy offers are unchanged for all five-minute intervals of each trading period from 22:00 on 13 July to 08:30 on 14 July. However, as is clearly evident in the figure, the structure of offers changes significantly from one trading period to the next over this time.
Figure 2: New Zealand energy offer stack from 22:00 on 13 July to 08:30 on 14 July

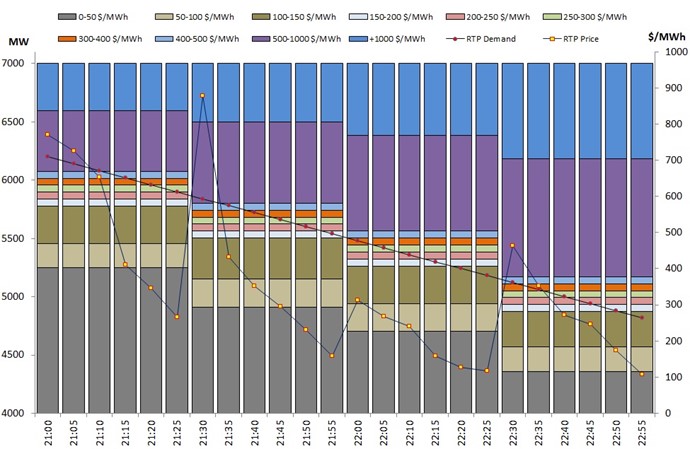
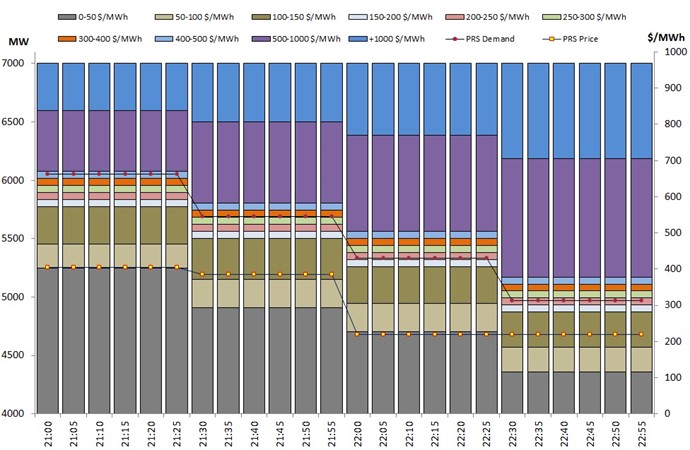
Closer examination of Figure 2 reveals that the low-priced energy offers decrease/increase in a pattern matching that of the demand profile shown in Figure 1. In other words, suppliers are offering in line with their expectations of demand. As a result of this, we see quite dramatic RTP price changes (either increase or decrease) from the last five-minute interval of one trading period and the first five-minute interval of the next.
Figure 3 and Figure 4 plot the movement in real-time and pre-dispatch prices, respectively, relative to offers and demand. From these plots the degree of price oscillation can be observed. Figure 3 shows the RTP price versus RTD demand - clearly the real-time prices are oscillating. Figure 4 shows the PRS price versus PRS demand (i.e. the average of RTP demand) and here the PRS prices are much more settled.
Figure 3: An illustration of RTP price oscillation

Figure 4: An illustration of relatively stable PRS prices


