In the Switching Summary report, what do the gains and losses and net percentages mean? What are they a percentage of? They numbers do not appear to be a percentage of the retailers' ICPs for that month or the prior month.
- Retail
- What does the retailer switching rate (gains and losses) in switching summary report mean?
What does the retailer switching rate (gains and losses) in switching summary report mean?
- 1.3K Views
- Last post 27 February 2017
The rate is the share of the regional switching rate attributed to the gains or losses from each retailer. Perhaps it’s easier to explain by example. If you sum the rates for the gains (or losses) for each retailer for 2016 in New Zealand you will get 20.06 per cent. This is the same rate as taking total switches in 2016 in NZ and dividing by the average number of connections during the year. This is shown in the 12-month rolling switch rate. I’m not sure breaking this measure down by the retailer is very useful, although what we have implemented is a consistent approach with the switch types.
We tried to cover this in the report note, although it gets tricky to explain:
Relative switching or switching rates calculate switches (filtered by switch type) as a percentage of the average number of active ICPs in the selected market segment and region during the period it is calculated for. Relative switching rates can, therefore, be summed for each switch type or retail entity and equate to the switch rate for all switches in the region and market segment.
What about retailer growth then?
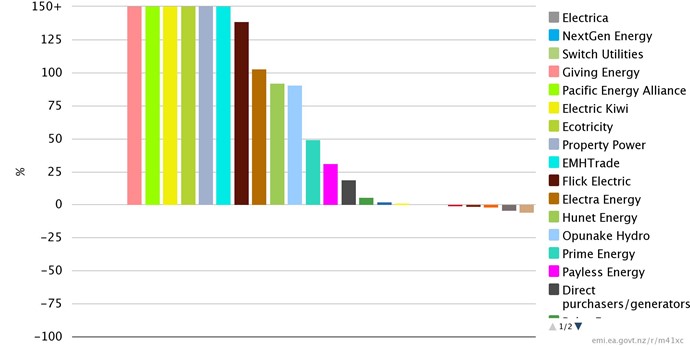
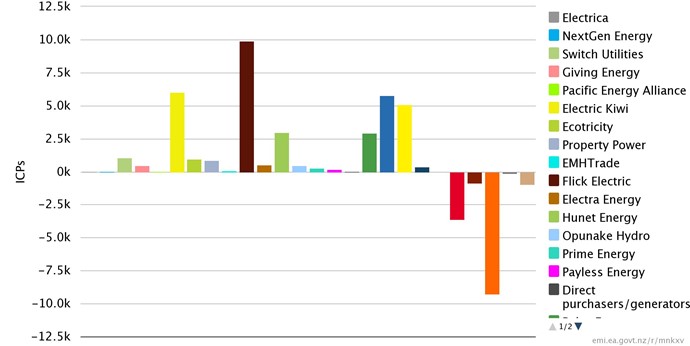
If you are looking for retailer growth we have another report that may be useful. Depending on the period you are concerned with; retailers that start with no ICPs will be blank (but can be turned off in the series filter if you need). Clearly, small retailers are able to achieve a far higher growth rate than is possible for any retailer with scale. We cap the chart y axis at 150% for this reason - although, it’s always worth switching the chart to ICP count to see which retailers are having a material impact on the market structure.
Retail parent company growth rate, 2016
Retail parent company growth in connections, 2016
- #Permalink
- 0
- 0
- 0
Find discussions by tag
This week's high earners
-
LFNZECS 2
-
MikeOS 2
-
kieranT 2
-
AndreaLong 2
-
RileyPeterson 2
-
 msouness
1


