
With assistance from retailers and some changes to the electricity registry transfer hub, we’ve enhanced our set of residential consumption reports so that they update on a monthly basis. This allows users to draw more timely insights. More timely information is especially helpful when trying to assess the impact that the Covid-19 response has had on residential consumption.
In addition to improving the timeliness of demand insights, we have also implemented enhancements to the residential consumption trends report:
- We have included a ‘residential demand’ option under the show parameter. Residential demand is the demand that residential consumption, as measured at the ICP, imposes on the electricity system, as if it were measured at the grid point of connection (POC). In essence, we’ve adjusted the consumption to account for local network losses so that we can equate demand across the residential and business sectors at the grid POC.
- Including options for the proportion of national or regional demand while excluding NZAS demand from the total. This parameter setting can provide useful insights into the breakdown of demand in a world without the Tiwai smelter.
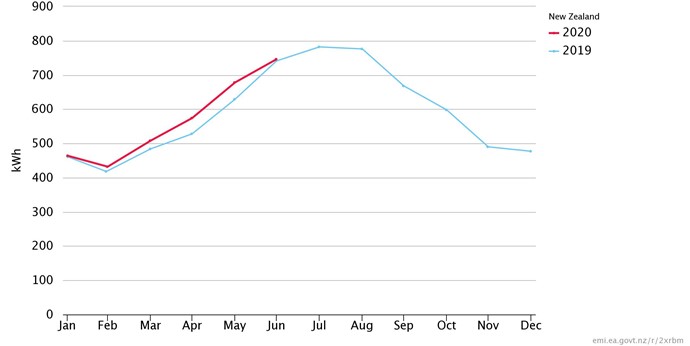
Residential consumption hit new records for March, April, and May, up 7.7 per cent against the same period in 2019.
Total residential consumption, 2019 - 2020 YTD
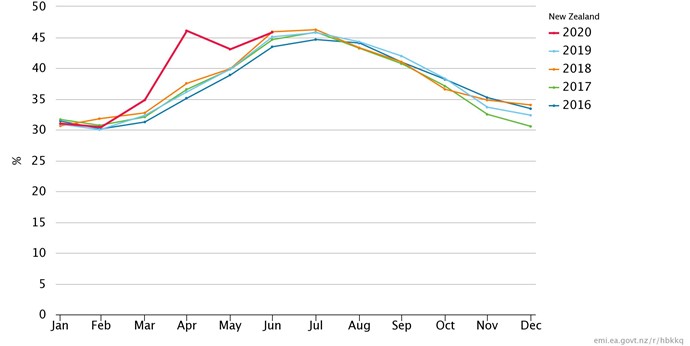
Residential demand varies from 30 per cent of total demand during the summer months when NZAS demand is excluded, to 46 per cent in the winter months. We can expect residential load to account for a much higher proportion of peak demand. However, we only have monthly data at this time so cannot demonstrate this.
Residential demand as a proportion of national demand excluding NZAS, 2016 - 2020 YTD
For more insights see the collection of residential consumption reports below:
Recall the ‘All dashboard instances’ button at the top right of any report will display report instances that our users find useful and have added to a dashboard.


