EMI report updated – Installed DG trends report now tracks size of new installations

  • 2.9K Views
  • Last post 22 September 2021
Matthew Keir posted this 28 August 2016

Efficiency is a key limb of the Electricity Authority’s statutory objective and efficient investment in generating plant is of interest. We track trends in the installed distributed generation (connected to local networks, not the grid) for many types of generation and fuel sources. Distributors are responsible for populating the registry with the information we use to do this.

Investors choose to invest in generating plant for a range of reasons. Recently there has been a lot of discussion about and interest in the economics of household generation, and how the economics might look relative to the underlying distribution and wholesale energy pricing that gets wrapped into retail plans.

The uptake in investment in solar generation in the residential market segment (now over 10,000 connections) provides a robust dataset to look at some of these trends. We can gain insights by looking at the timing of new generation investment and the capacity of these new investments.  This may provide a useful view of how residential investors are responding to existing price signals in the market at the time of investment or perhaps expectations of future changes.

In terms of solar photovoltaic generation we have observed residential investors responding to changes in the price signals they face – these include but are not restricted to:

  • the reduction in the price of solar panels and inverters,
  • historical increases in retail pricing, and
  • the 25 cents/kWh buy back rate for the first 5 kWh exported each day that was offered by Meridian Energy until December 2014.

Here are a couple of examples focused on small solar connections that show some interesting insights:

  • The residential (< 10 kW) average new installation size has decreased from 3.722 kW in August 2014 to 3.221 kW in July 2016. Does this suggest residential investors are focusing on self-consumption rather than selling excess back to the market?

Average size of new residential PV installs by month

  • South Island residential investors (< 10 kW) on average invest in an array 300 Watts larger than their North Island counterparts. (South Island residential consumers consume more electricity than their North Island counterparts and perhaps get fewer sunshine hours?)

Average size of residential PV installations

Observing changes in investments in response to changing market conditions provides valuable insights into economic efficiency and investor preferences.

  • Liked by
  • msouness
Order by: Standard | Newest | Votes
graeme posted this 29 April 2018

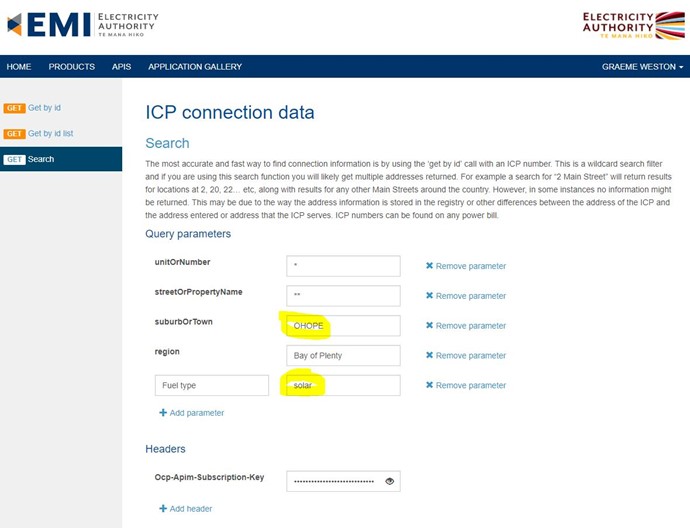
 Is it possible to use EMI tools get a List of ICPs at Town=Ohope that have FuelType=solar ?


  • Liked by
  • msouness
Matthew Keir posted this 29 April 2018

Hi Graeme,

No sorry - this is not possible with an EMI tool. We publish aggregated results on EMI. The exception being the ICP connection data API which was released as part of policy work around access to retail data https://www.ea.govt.nz/development/work-programme/consumer-choice-competition/retail-data/.

The API allows access to selected information from the registry at an ICP. There is a search call available that assists users to discover the correct ICP at an address. However, you can't construct queries in the registry to search any other field or combination of fields. More information on these issues was discussed during the project https://www.ea.govt.nz/development/work-programme/consumer-choice-competition/retail-data/development/tariff-and-connection-data-decisions-and-reasons-paper/.

Cheers,

Matthew

graeme posted this 30 April 2018

 Thanks for reply Matthew

I represent a group of prosumers (incl. a couple of EVs) about to talk to Horizon about offering FCAS if we splashed out on more rooftop PV and batteries. Cannot be justified unless we can get better feed in rates. We believe grid tied is good for NZ. Ohope grid is approaching max. capacity so upgrades required. Having access to ICP data helps assist in decision process.

Does the ICP registry have fields for battery data if installed?

Eastern Bay of Plenty (EBOP) is net exporter of energy. If transmission charging was user pays and related to distance from generator we would not be paying the high fixed rate which has 30% impact on investment return. Present (not smart) Transmission Charging Methodology effectively a subsidy which has distorted location of some industry which should be in EBOP or Southland. Again query access to Registry will assist putting discussion documents together. Could you point us to someone at EA who can assist please?

Regards, Graeme

Matthew Keir posted this 30 April 2018

Hi Graeme,

To answer your questions above:

(1) The Authority has a project looking at monitoring the uptake of new technology. This project, amongst other things, will look at monitoring the uptake of batteries. Keep an eye out for something later this year. It would be great if you could make a submission at the time as we’d love to hear your views.

(2) Each participant with access to the registry can see details only for the ICPs they are responsible for except via the ICP and address search. There is no query interface and direct access to the full registry is restricted by terms of use agreements. As discussed above, the API allows details for individual ICPs to be obtained, much in the same way as you might look at google maps to see if a house has solar panels. The use of the API is unrestricted. The Authority is aware that some users are pushing through many addresses/ICPs to obtain larger sets of information. You might consider this method as a way to get what you are after?

Also, see a related post on connecting to the API via excel. https://www.emi.ea.govt.nz/Forum/thread/api-icp-connection-data-access-via-ms-excel/

Cheers,

Matthew


Matthew Keir posted this 01 May 2018

Hi Graeme,

Further to my earlier post - just checking you have drilled into the aggregated stats that are available in this report.

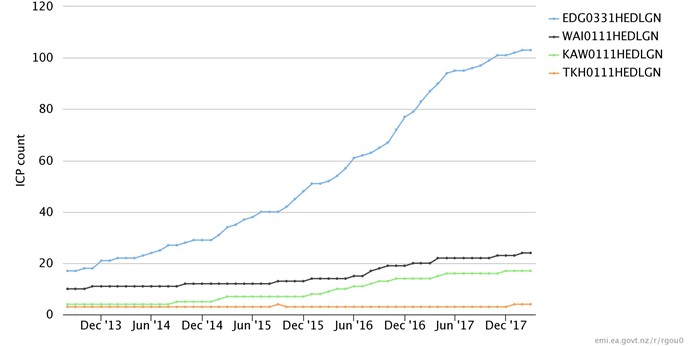
For example Solar connections by root NSP in the Eastern Bay of Plenty

To find the relevant NSPs, I've taken a look at the NSP mapping table and filtered by the GN NSPs in the EBOP network.

I hope that's helpful.

Cheers,

Matthew

dataknut posted this 03 August 2018

Hi, I'm having some difficulty making ICP counts add up. e.g. www.emi.ea.govt.nz/r/pptnx


Month end Region ID Region name Capacity Fuel type ICP count ICP uptake rate (%) Total capacity installed (MW) Avg. capacity installed (kW) ICP count - new installations Avg. capacity - new installations (kW)

31/08/2013 NZ New Zealand All combined Solar 1239 0.07 4.41 3.56 201 3.44

30/09/2013 NZ New Zealand All combined Solar 1478 0.09 5.20 3.52 114 3.25

31/10/2013 NZ New Zealand All combined Solar 1653 0.10 5.76 3.48 154 3.02


If I add the new installs for this month to the ICP count for last month I don't get the ICP count for this month. What am I missing?


thanks!

Matthew Keir posted this 07 August 2018

Thanks for your question – it’s an interesting one. We’ve had a closer look at what’s going on and have provided some comment below.

The totals represent the state of fields in the registry and will accurately represent the best information we have. The monitoring of new installations is a bit more complex as we are reporting on the change event for a field within a transactional database segmented by other attributes which are subject to change at any time.

It seems there are three things contributing to the differences:

1. Differences due to market segmentation or other attributes 

This is best explained with an example. Consider a commercial ICP that gets PV installed and then, sometime later, changes to the residential market segment. In this case, the ICP with solar will now count towards the total residential count, but the new installation details would have counted in the commercial market segment. A similar situation could occur with attributes like ICP status etc.

2. Differences due to installations that are removed from the data without reversing the event

In this case, an ICP is given a PV installation that is then removed via a new event sometime later. This would mean that the ICP no longer counts in total numbers, however, they will still count as a new installation in the month it shows in the data. If these cases were entered in error, the correct method would be for the participant responsible to reverse or replace the event in the registry.

3. Differences due to multiple new installations being recorded

Similar to the case above where generation at an ICP is removed rather than the event being reversed. There are times where a new PV installation is added, its removed, and then added again at the same ICP. In this situation the total will be correct, however, the situation would have resulted in counting two new installations. We’ve made some changes to our data processing to try and avoid these instances of double counting. These changes have been deployed.

I hope this explanation helps. It is an important reminder to participants to use reversals or replacement events correctly when maintaining the fields they are responsible for within the registry.

CEP123 posted this 22 September 2021

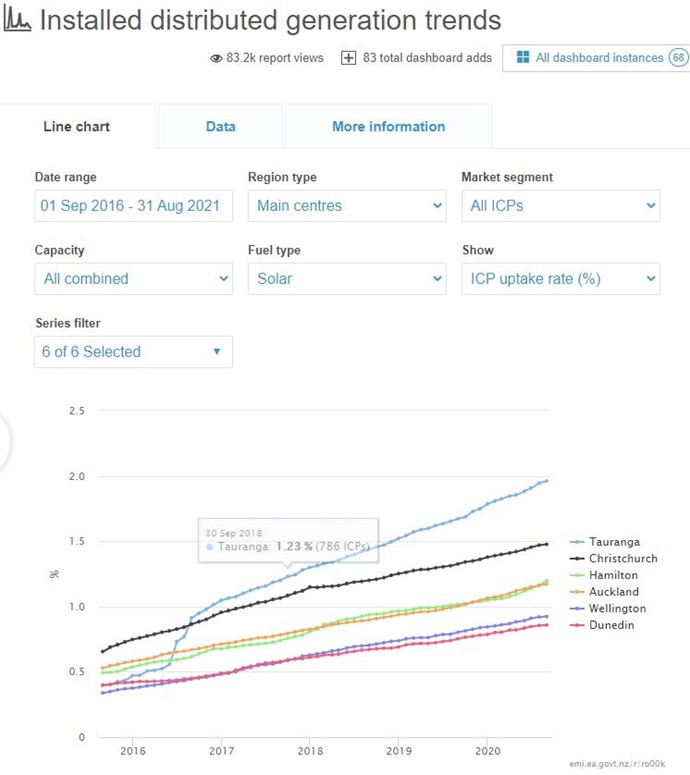
Installed generation trends

Hi there,

When reviewing the main centre ICP uptake, what is the reason for the massive jump late 2016 for Tauranga? An increase in Solar connections, a decrease in total connections, a reclassification of sorts, or something else? The sudden jumps seem a bit too sudden.

Thanks,

Dion

  • Liked by
  • AndreaLong