
We’ve added a trend report for residential consumption that helps users observe changes in residential energy consumption through time and contrast these trends between regions. The data is monthly resolution collected from EIEP1 files so we are unable to provide any commentary on daily residential profiles or trends at this time. More information on the data and cleaning process is provided with the reports.
Below are some examples of insights that can be made by exploring the data:
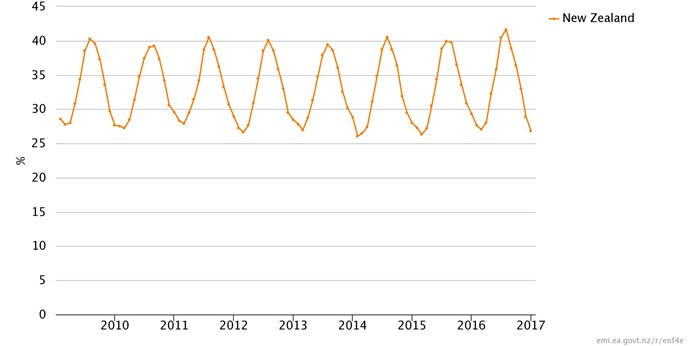
What does residential demand mean in the context of total demand?
- The contribution to total energy demand from residential consumption ranges from 26 per cent in summer to just over 40 per cent in winter months. July 2017 was a new record where the residential market was responsible for 41.6 per cent of energy demand during the month.
Figure 1: Residential market contribution to total energy demand
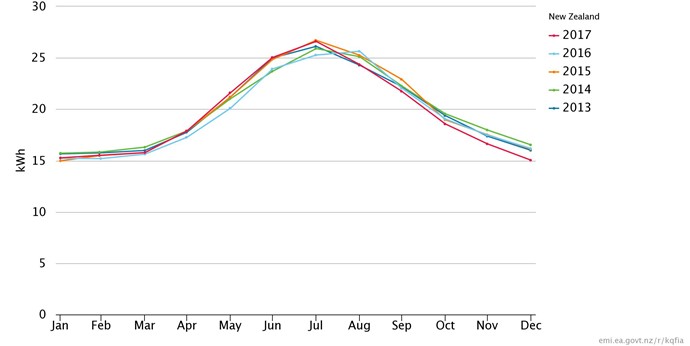
Combining trend reports with the time comparison feature makes a powerful tool to explore even further
- Comparison of daily average consumption each month over the last five years. Try drilling through and changing region type and the region selected in the series filter.
Figure 2: Daily average residential consumption by month, 2013 - 2017
Registered users can subscribe to receive notifications of discussions in categories or with tags that they are interested in. For example, to receive “EMI news” notifications click follow at the top of this page.


