‘My dashboards’ is a powerful feature we’ve introduced to EMI for registered users (you can register by clicking 'register' at the top of the screen or here).
The ‘my dashboards’ feature allows you to construct your own dashboards that are compiled from report views that you save. Developing your own customised dashboards on EMI allows you to quickly gain updated insights from the reports you’re especially interested in. The feature can also be used as a favourites list for frequently visited reports. These options make EMI easier and more efficient for you to use.
To add a report to a dashboard, select the  button found at the bottom of any report. This will bring up a dialog box of settings.
To get started quickly, you can simply accept the defaults, enter a dashboard name, and hit add. Many report views can be added to a single dashboard.
There are four key features to consider when adding a report:
- How would you like to handle date parameters?
- How do you want to handle other parameters?
- Which dashboard do you want to add the report to?
- What do you want to call each report view on your dashboard?
1. How would you like to handle date parameters?
Three alternative situations for handling date parameters are explained below. These depend on the report and report parameter settings you have selected.
A. For reports with a single date parameter there are two options:
- Use the default report date. This ensures that the report view in your dashboard will update as the dates change on the underlying report. Reports generally default to the latest date.
- Save the selected report date to permanently capture a view of a point of time.
Example: A report showing monthly snapshot data

Try it yourself here.
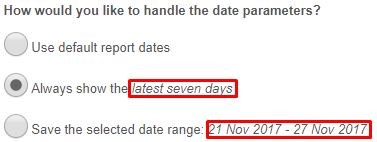
B. For reports with time range parameters there are three options:
- Use the default report dates. This ensures that the report view in your dashboard will update as the date range changes on the underlying report.
- Save the selected quick range to always show this range (e.g. latest seven days) whenever the dashboard is viewed. This option is only available if the report being added is currently set to a quick range through the date selection parameter. This option is great when you want a dashboard to automatically stay up-to-date and the default date range does not work for you.
- Save the selected report date range to capture a view of a point in time. This option allows you to save a report illustrating a market event or to save a specific view in your dashboard.
Tip: using dashboards to capture a view of a point in time works great if you have a temporary dashboard set up while you are looking into a topic, exploring a market event or developing a story.
Example: A report showing the latest seven days, i.e. the ‘latest seven days’ was selected when viewing the report before adding the report to the dashboard.

Try it yourself here.
C. For time series report with a time comparison added there are two options:
The time comparisons feature is an advanced feature that enables you to make time comparisons of a single time series for set lengths of time, e.g. compare this week to last week. These options are only relevant if you have added a time comparison to a report.
- Save the selected quick range and relative time comparisons. An example might be adding a report view that always shows the latest seven days, compared to the two preceding weeks.
- Save the selected report date range and time comparisons to capture a view of a point in time including the comparisons.
Example: A report showing a time comparison of the last seven days with the preceding two weeks

Try it for yourself here.
2. How do you want to handle the other parameters?
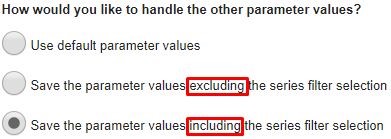
Handling the other report parameters is simpler than the date parameters. You have three options:
- Use default report parameters
- Save the parameters excluding the series filter selection (if available). This option allows you to save the parameters you have changed while letting the data and default chart settings drive the series filters.
Tip: combining this selection with a quick range selection means that your dashboard report won’t filter out the entry of new participants (if participants are the series in the report). - Save the parameters including the series filter selection. This option will only be available when you have changed the series filter parameter.
Example: A report where the series filter has been changed

3. Which dashboard do you want to add the report to? (or create a new dashboard)
You need to select a dashboard to add the report view to or you can add a name for a new dashboard. You are able to create up to five dashboards. The number of reports (or report views) in a dashboard is not currently limited although only eight reports are shown on each page.
4. What do you want the report view to be called in your dashboard?
Report names on EMI are rather generic to accommodate the range of views and insights that can be seen by changing report parameters. For example, showing a trend line for all of New Zealand or just one specific region.
You can add a specific name for the report and parameter selections you've saved to make it more meaningful to you in your dashboard. This naming feature is especially useful when you have added multiple views from the same report to the same dashboard (for example, perhaps illustrating activity in different regions).
See viewing ‘my dashboards’ and managing ‘my dashboards’ for more assistance on using the ‘my dashboards’ feature.


