
Following the recommendation in the Electricity Price Review, MBIE has investigated and consulted on options to phase out the low fixed charge (LFC) regulations. The Authority provided MBIE with information to inform and support their analysis and options development.
Two charts are presented below to highlight some of these insights and inform other interested parties.
Figure 1: Distribution of consumption for primary residences supplied through LFC and standard plans - 2020
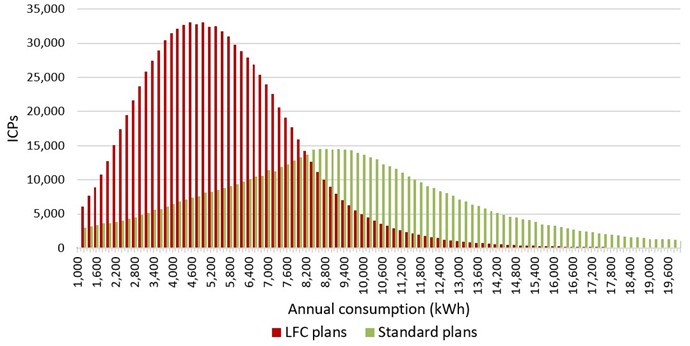
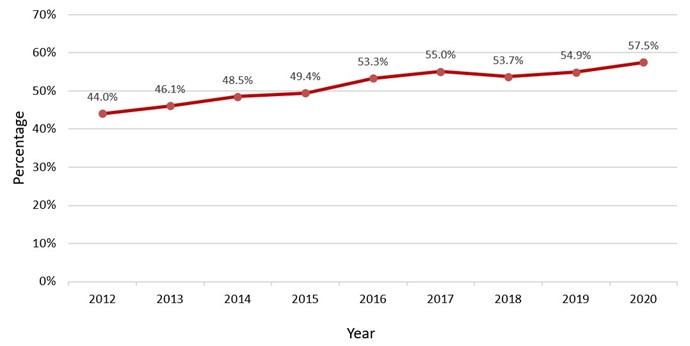
Figure 2: Proportion of primary residences supplied through LFC plans over time
Note:
1. Retailers are not required to record primary residences and the approach varies significantly across the industry. Some ICPs were filtered out from these results due to inconsistencies or lack of consumption data, so the counts will be less than the total primary residences. LFC status is at 31 Dec 2020 and consumption data is for 2020. LFC plans must be offered to primary residences but are not required to be offered to holiday homes etc.
2. Annual consumption thresholds of 8000kWh and 9000kWh (in the lower South Island) where consumers will be better off selecting an LFC plan are set in the regulations. The figures above only present aggregated national results.
Attachment: The attached file includes the data presented in Figure 1.


