Residential consumption and savings figures have been updated for 2016. League tables offer users a simple view ranking the difference amongst regions and highlighting the change on the previous year.
The tool tip surfaced by hovering over the data points (or clicking the data on a mobile device) provides additional information about the change in rank or value on the previous year.
Figure 1: Additional information in the tool tip

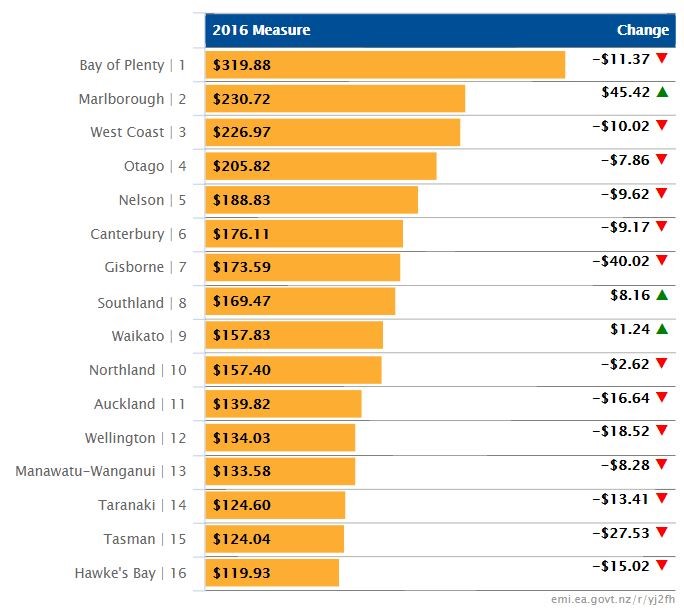
Figure 2 shows the average residential savings for regional council regions. Bay of Plenty and Marlborough consumers stood to save more than other regions by switching retailers in 2016. Notes accompanying each report explain the assumptions in this analysis.
Figure 2: Average residential savings, 2016

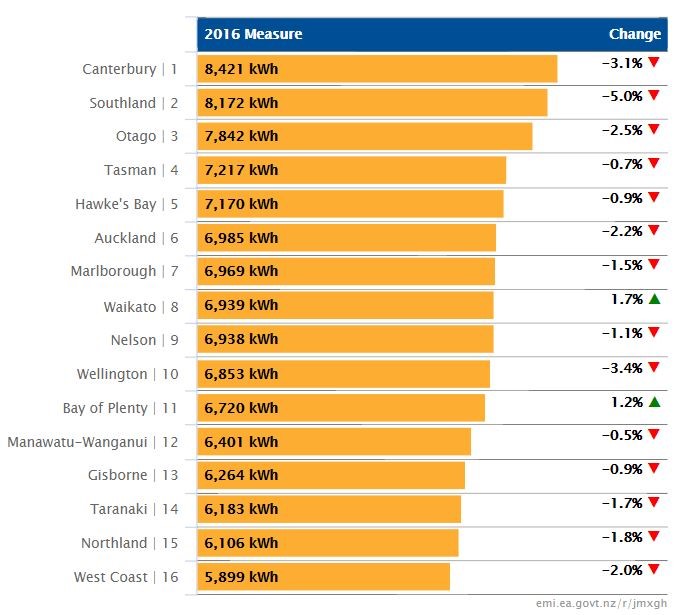
Figure 3 shows the average residential consumption by regional council regions in 2016 and the change from 2015. Other parameters allow users to change the region types or view the totals and change in total by regions.
Figure 3: Average residential consumption, 2016


