Switching summary detailed data request

  • 870 Views
  • Last post 06 October 2019
  • Discussion is solved
jofajafa posted this 05 June 2019

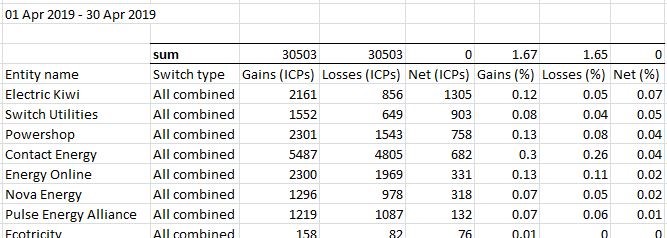
Hi EA, I'm wondering if the Switching Summary dataset could be expanded to the underlying time series data? Currently if selecting an extended period of time the data shows open and close detail against the time period, and not the monthly data across that time period. It's the by-month data that's more relevant. Particularly as for the faster growing challenger brands, the rate numbers shown aren't that meaningful when they're stated off a low opening base for any extended period.

I may be missing something, but I cannot see how the dataset across multiple months can be generated and downloaded in a single instance.

Thanks.

Order by: Standard | Newest | Votes
Matthew Keir posted this 05 June 2019

Hi jofafafa,

Nice work on publishing your dashboard! It's great to see people such as yourself engaging with EMI to draw and share insights.

The summary report you are looking at is specifically designed to summarise across time (ie sum). You've probably seen there is a collection of switching reports available.

However, in this instance an answer to the time series question is available in this earlier post. A quick way to explore related discussions is to use the discussion tag below the report to see all related discussions.

Hope that helps.

Matthew

jofajafa posted this 05 June 2019

 Ah, thanks Matthew. I had a feeling that may have been asked previously but could find neither the thread nor the dataset. Thanks for the prompt response.

Although the limitation it appears with that data is that it can't be split by segment, for reporting only by Residential for example.

jofajafa posted this 05 June 2019

Also, there's no opening/closing ICP number reference so with respect to charting switch rate it's useless without also referencing a separate table of opening and closing ICPs selected against the same criteria of region type, entity type. Which is doable but less than ideal. It starts to look like pulling the switch rate detail by individual months and consolidating those tables might be easier, as painful as that would be.

Matthew Keir posted this 05 June 2019

It can, but only for a time range for which we have the data. Check out this.

Under the 'more information' tab, you'll see that market segments are only available from 2013.

Also with respect to your dashboard - you could add the summary report for each of the last 12 months (using the custom date range parameter). The system will recognise these and roll them forward each month to always show the last twelve if you save them with relative dates.

Cheers,

Matthew

  • Liked by
  • jofajafa
Matthew Keir posted this 06 June 2019

Regarding your second post above, if you are looking for market share at a monthly resolution (opening/closing ICP numbers) you can get that from the market share trends report. However, there are multiple reasons that market share changes - ICPs are not only acquired through customer switching. You should also note that market share and switching are offset slightly - that is discussed here.

The switching rate in the summary report and its usefulness is discussed here.

jofajafa posted this 07 June 2019

Matthew, unforunately the switch rates as shown in the Switching summary dashboard appear to be massively understated. Deriving a percentage rate within each month based on losses for the month proportionate to the opening ICP count produces very different, larger figures. What am I missing?

Matthew Keir posted this 09 June 2019

Did you take a look at the discussion here? Try downloading the data and summing across all traders - you'll see that it sums to the switch rate for the region. If the switch rate in the region for a month is 1.67 per cent, each trader is responsible for part of that rate. The divisor is ICPs in the region, not the trader's ICPs. (1.65 and 1.67 are different due to rounding issues). Like I said in the other post I'm not sure this is that useful. If you are looking for retailer growth - I suggest you use the retailer growth report (although this will include all ways ICPs are acquired, not just through switching).

jofajafa posted this 09 June 2019

Thanks Matthew. I did see that thread,but didn't fully appreciate the significance of it - I'm starting to now. It will take a while to fully get my head around it!

msouness posted this 04 October 2019

I'd be interested in seeing the switch withdrawal data - are these available for publication?

i.e. gaining trader, losing trader, number of withdrawals per month

  • Liked by
  • jofajafa
jofajafa posted this 06 October 2019

"I'd be interested in seeing the switch withdrawal data - are these available for publication?

i.e. gaining trader, losing trader, number of withdrawals per month"

I would say that it would be an absolute necessity at this point in time to start baselining that data and tracking it over time. As the EPR recommendations take effect then withdrawals should drop significantly (and be more for reasons such as the incorrect ICP being signed up, than competitive activity). There should be a dataset/dashboard that displays this information and shows that trend.

Matthew Keir posted this 06 October 2019

Hi Malcolm,

Yes, some data is available, take a look at the link to the switching breakdown data report below. This data doesn't tell you which trader made the withdrawal.

www.emi.ea.govt.nz/r/f1osv

There is a bit more discussion in the following post.

https://www.emi.ea.govt.nz/Forum/thread/customer-withdrawn/

Cheers,

Matthew

  • Liked by
  • msouness